Glossary
Destination graph
A museum appears in a regional guide, a walking route and a partner’s itinerary. Its location stays the same, while each explanation serves a different visitor need.
A destination graph is a structured model of a destination’s places, routes, activities, services and partners, with explicit relationships and supporting sources.
Each record identifies something particular. The relationships explain where it belongs, what it connects with and which information supports the description.
What the connections mean
Useful relationships say something precise:
- A village belongs to a region.
- A walking route includes a particular stop.
- A local partner operates a guided visit.
- A source supports a statement about access.
Where a relationship depends on dates or conditions, those details need to remain attached to it.
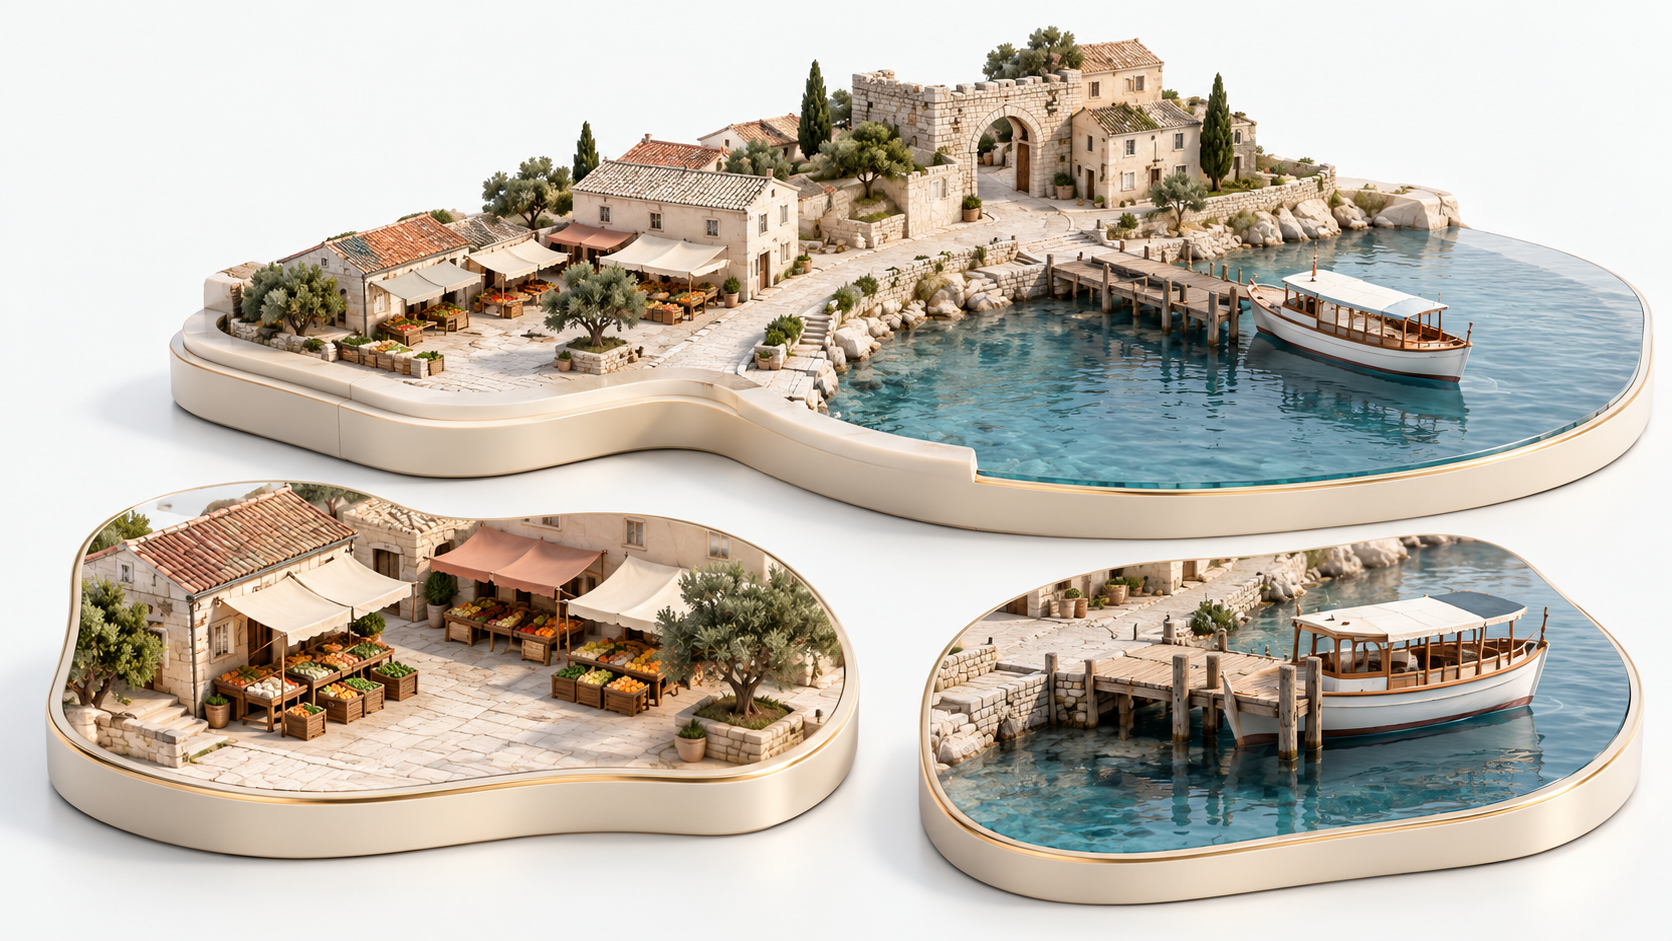
A diagram can illustrate these connections. The working model consists of the records and the meaning of their relationships.
A tourism example
Consider a fictional cultural route connecting two villages, a small museum and a guide cooperative.
The model connects each village to its region, the museum to its village, and the cooperative to the walk it operates. The museum’s location has a shared record. The guided walk retains its own starting point and joining conditions.
A destination guide can introduce the places together. An itinerary can explain the sequence of the visit. A partner profile can describe the cooperative’s contribution. Each uses the relevant information while preserving its particular context.
If access to the museum changes, the source and affected relationships help the editor identify which explanations need review.
What it helps an organization maintain
A destination graph gives shared information an identifiable home and makes connections available for different guides, pages, languages and working processes.
Its usefulness depends on clear identities, meaningful relationships and maintained sources. Existing translations, partner pages and downloaded material still need appropriate follow-through when information changes.
Start with the places and relationships your organization already uses.
Where to continue
For designing and building the connected model, Travel knowledge graphs explains the implementation work.
When the question concerns timing and suitability across the year, Season Graph explains the seasonal context.
To decide how pages answer successive reader questions, Topical Mesh explains the editorial work.